Grafik Heeling Arm
Sering sekali dalam kegiatan Towing Tug & Barge tiba-tiba ditanyakan tentang heeling arm Tug Boat pada saat towing. Menjawab ini tidak serta merta mudah meskipun penanya (Client atau Surveyor) sudah sangat memahami kondisi aman yang ada pada apa yang kita sudah propose.
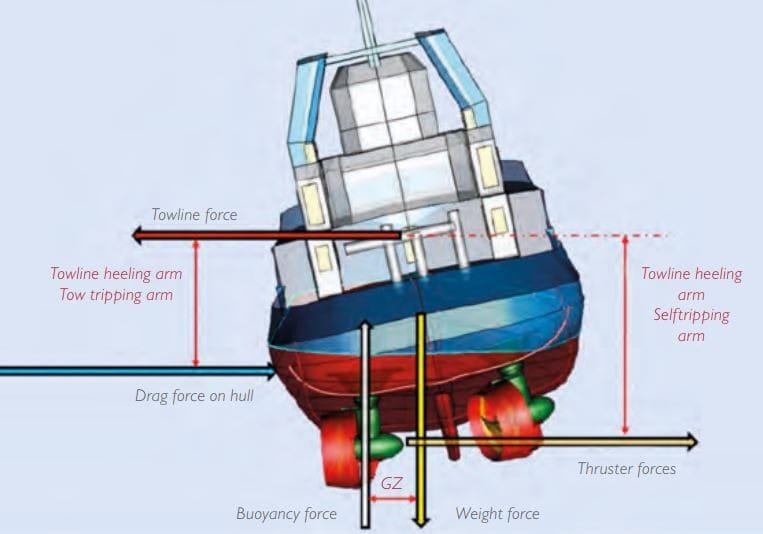
Heeling arm pada tug boat adalah jarak horizontal antara titik tumpu gaya tarik tali tambat dan pusat gravitasi kapal. Heeling arm menimbulkan momen (heeling moment) yang cenderung membuat kapal miring ke samping. Besarnya heeling arm dipengaruhi oleh faktor-faktor seperti panjang, diameter, dan sudut tali tambat, serta berat dan kecepatan kapal yang ditarik.
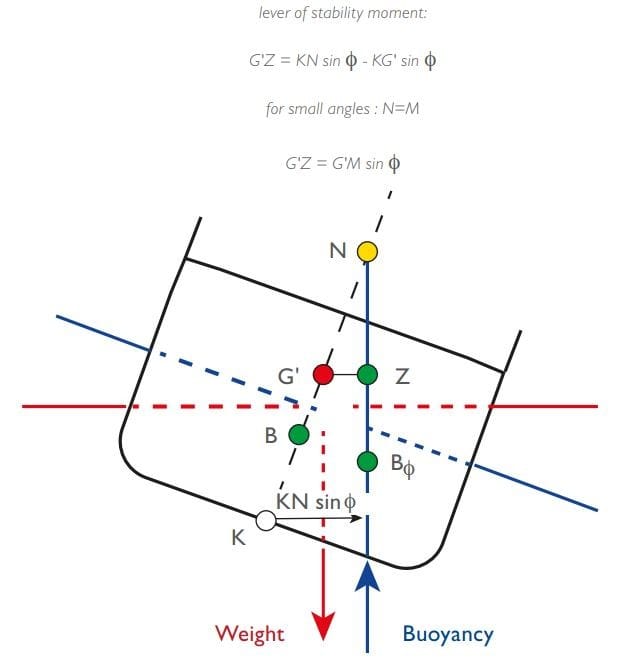
Biasanya heeling arm harus dibandingkan dengan righting arm, yaitu jarak horizontal antara pusat gravitasi dan pusat buoyancy kapal, yang menentukan stabilitas kapal. Jika heeling arm lebih besar dari righting arm, kapal bisa terbalik. Oleh karena itu, analisis stabilitas kapal tug boat sangat penting untuk menjamin operasi yang aman dan efesien.
Berikut adalah tips cepat untuk membuat visualisasi grafik heeling arm versus kurva stabilitas kapal (GZ) dengan menggunakan python yang dapat dijalankan di google collab.
Masukkan:
- B = 7.30 # Lebar Tug Boat [m]
- h = 3.50 # Tinggi Tug Boat [m]
- GM = 3.8 # Misalnya Tinggi Metacentric [m]
- Z = 4.303 # Tinggi pusat Towing Hook dari Keel [m]
- KB = 0.65 # Tinggi Keel ke titik Buoyancy
- Zh = Z – KB # Jarak Towing Rope to KB
- T = 117.6 # Bollard Pull Force [kN]
- D = 250 # Displacement Tug Boat [ton]
Formula dari BKI:
![\[ \boxed{b_h = \frac{0.071\cdot T \cdot Z_h \cdot cos(\theta)}{D}} \]](https://www.alvinburhani.net/wp-content/ql-cache/quicklatex.com-eed7301339e0e2d7bae6c2eb18030aa8_l3.png "Rendered by QuickLaTeX.com")
Maka untuk Code Pythonnya adalah sebagai berikut:
import numpy as np
import matplotlib.pyplot as plt
# Function to calculate GZ (Righting Arm)
def calculate_GZ(GM, theta):
return GM * np.sin(np.radians(theta))
# Function to calculate HA (Heeling Arm) based on BKI
def calculate_HA(T, Zh, D, theta):
return 0.071 * T * Zh * np.cos(np.radians(theta)) / D
# Parameters of Tug Boat
B = 7.30 # Breadth of Tug
h = 3.50 # Depth of Tug
GM = 3.8 # Example Metacentric Height
Z = 4.303 # Height of Towing from Keel
KB = 0.65 # Height of Keel to Buoyancy
Zh = Z - KB # Distance of Towing Rope to KB
T = 117.6 # Bollard Pull Force
D = 250 # Displacement of Tug Boat
theta_values = np.arange(-90, 181, 1) # Angle of heel from -90 to 180 degrees
# Calculate GZ and HA for each angle of heel
GZ_values = calculate_GZ(GM, theta_values)
HA_values = calculate_HA(T, Zh, D, theta_values) + KB # Include KB
# Find the minimum angle of the Tug Boat
hB = B / 2 # Asumsi setengah dari lebar Tug Boat
hh = h / 2 # Asumsi setengah dari tinggi Tug Boat untuk sudut terbesar saat miring
min_theta = -np.degrees(np.arctan2(hh, hB))
# Find the index corresponding to the minimum angle and maximum GZ value
min_theta_index = np.argmin(np.abs(theta_values - min_theta))
max_GZ_index = np.argmax(GZ_values)
# Plotting GZ and HA curves on one graph
plt.figure(figsize=(15, 8))
plt.plot(theta_values, GZ_values, label='Righting Arm (GZ)', color='green')
plt.plot(theta_values, HA_values, label='Heeling Arm (HA)', color='blue')
plt.axhline(0, color='black', linewidth=1, linestyle='solid') # Horizontal line at y = 0
plt.axvline(0, color='black', linewidth=1, linestyle='solid') # Vertical line at x = 0
# Fill the area between min_theta and max_GZ
plt.fill_between(theta_values[min_theta_index:max_GZ_index+1],
GZ_values[min_theta_index:max_GZ_index+1], color='green', alpha=0.3,
label='Area between Min Tug Boat Angle and Max GZ')
# Fill the area between GZ_values and HA_values
plt.fill_between(theta_values, GZ_values, HA_values,
where=(GZ_values >= HA_values) & (theta_values <= theta_values[max_GZ_index]),
color='gray', alpha=0.3, label='Area between GZ and HA')
# Plot vertical lines at intercepts using plt.vlines
ha_intercepts = np.where(np.diff(np.sign(HA_values)))[0]
plt.vlines(theta_values[ha_intercepts], ymin=0, ymax=max(max(GZ_values), max(HA_values)),
color='red', linestyle='-.', alpha=0.5, label='Max Tug Boat Angle')
# Plot vertical line at the minimum angle of the Tug Boat
plt.axvline(min_theta, color='purple', linestyle='--', label='Min Tug Boat Angle')
# Plot vertical line at the maximum GZ value
plt.axvline(theta_values[max_GZ_index], color='orange', linestyle='--', label='Max GZ')
# Set labels and legend
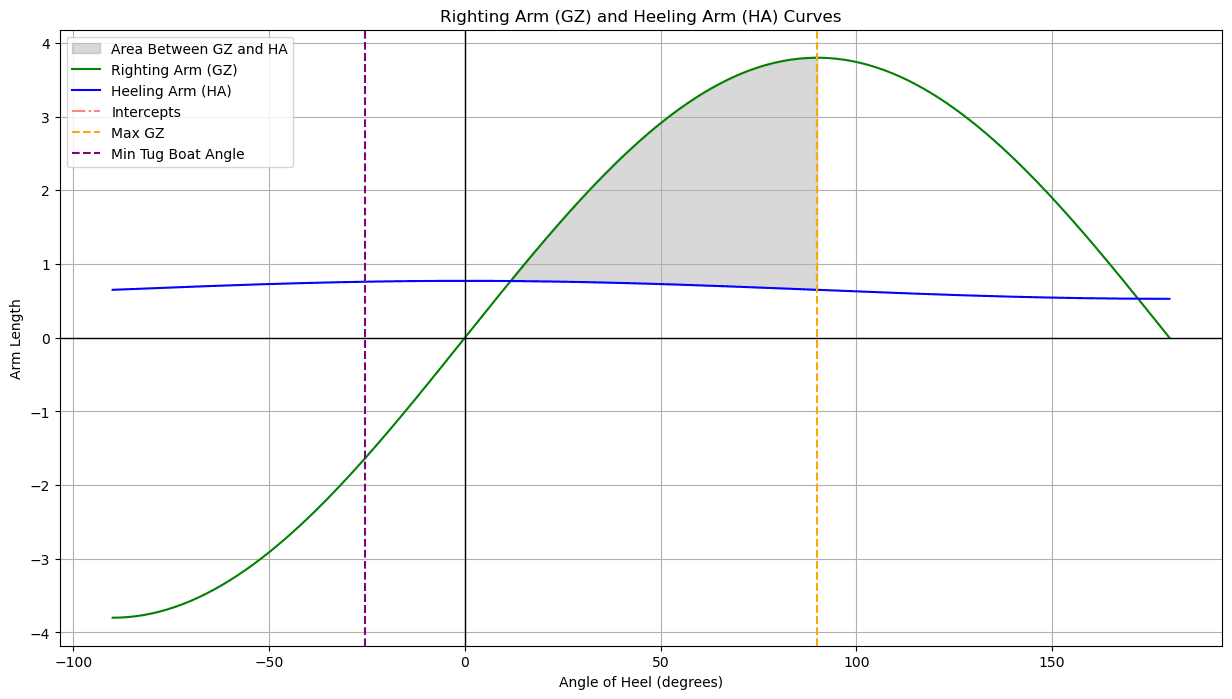
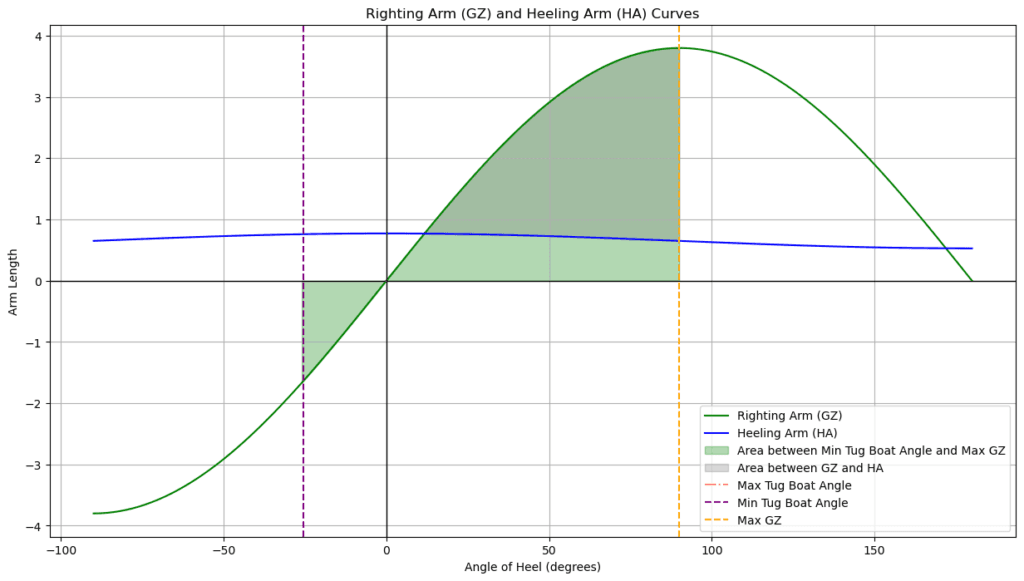
plt.title('Righting Arm (GZ) and Heeling Arm (HA) Curves')
plt.xlabel('Angle of Heel (degrees)')
plt.ylabel('Arm Length')
plt.legend()
plt.grid(True)
plt.show()
Grafik Outputnya: