
Gantt Chart dengan Python

Dengan sejarah lebih dari 100 tahun, visualisasi ini terus sangat berguna untuk manajemen proyek. Henry Gantt awalnya membuat grafik untuk menganalisis proyek yang telah selesai. Lebih khusus lagi, ia merancang visualisasi ini untuk mengukur produktivitas dan mengidentifikasi karyawan yang berkinerja buruk. Selama bertahun-tahun, itu menjadi alat untuk perencanaan dan pelacakan, sering dibuang setelah proyek selesai.
Tidak dapat dipungkiri bahwa bagan Gantt telah banyak berubah sejak desain pertamanya. Analis memperkenalkan banyak pengkodean untuk menampilkan perbedaan antara departemen, kelengkapan tugas, dependensi, tenggat waktu, dan banyak lagi. Artikel ini akan mengeksplorasi cara membuat bagan Gantt menggunakan Python, Pandas, dan Matplotlib.
Untuk contoh ini, kita akan membutuhkan beberapa data dummy; himpunan data yang akan kita gunakan memiliki kolom untuk nama tugas (Task), departemen, tanggal mulai dan berakhir, dan penyelesaian dengan struktur data seperti tabel dibawah ini:
| Task | Department | Start | End | Completion |
|---|---|---|---|---|
| TASK M | IT | 17-Mar-22 | 20-Mar-22 | 0 |
| TASK N | MKT | 17-Mar-22 | 19-Mar-22 | 0 |
| TASK L | ENG | 10-Mar-22 | 13-Mar-22 | 0 |
| TASK K | PROD | 9-Mar-22 | 13-Mar-22 | 0 |
| TASK J | PROD | 4-Mar-22 | 17-Mar-22 | 0 |
| TASK H | FIN | 28-Feb-22 | 2-Mar-22 | 1 |
| TASK I | MKT | 28-Feb-22 | 5-Mar-22 | 0.4 |
| TASK G | FIN | 27-Feb-22 | 3-Mar-22 | 0.7 |
| TASK F | MKT | 26-Feb-22 | 27-Feb-22 | 1 |
| TASK E | ENG | 23-Feb-22 | 9-Mar-22 | 0.5 |
| TASK D | FIN | 22-Feb-22 | 1-Mar-22 | 1 |
| TASK C | IT | 21-Feb-22 | 3-Mar-22 | 0.9 |
| TASK B | MKT | 19-Feb-22 | 24-Feb-22 | 1 |
| TASK A | MKT | 15-Feb-22 | 20-Feb-22 | 1 |
Kemudian, menambahkan kolom dengan jumlah hari dari awal proyek hingga awal setiap tugas; Ini akan membantu memposisikan batang pada sumbu x. Sama juga untuk akhir tugas; maka ini akan memfasilitasi penghitungan total hari yang diperlukan untuk menyelesaikan task, panjang bar, dan membantu memposisikan teks di kemudian nanti.
import pandas as pd import matplotlib.pyplot as plt import numpy as np df = pd.read_excel('plan.xlsx') # project start date proj_start = df.Start.min() # number of days from project start to task start df['start_num'] = (df.Start-proj_start).dt.days # number of days from project start to end of tasks df['end_num'] = (df.End-proj_start).dt.days # days between start and end of each task df['days_start_to_end'] = df.end_num - df.start_num |
Sekarang kita dapat memplot bagan batang. Y akan menjadi nama tugas, lebarnya adalah jumlah hari antara awal dan akhir tugas, dan kiri adalah jumlah hari antara proyek dimulai hingga tugas dimulai.
# create a column with the color for each department def color(row): c_dict = {'MKT':'#E64646', 'FIN':'#E69646', 'ENG':'#34D05C', 'PROD':'#34D0C3', 'IT':'#3475D0'} return c_dict[row['Department']] df['color'] = df.apply(color, axis=1) from matplotlib.patches import Patch fig, ax = plt.subplots(1, figsize=(16,6)) ax.barh(df.Task, df.days_start_to_end, left=df.start_num, color=df.color) ##### LEGENDS ##### c_dict = {'MKT':'#E64646', 'FIN':'#E69646', 'ENG':'#34D05C', 'PROD':'#34D0C3', 'IT':'#3475D0'} legend_elements = [Patch(facecolor=c_dict[i], label=i) for i in c_dict] plt.legend(handles=legend_elements) ##### TICKS ##### xticks = np.arange(0, df.end_num.max()+1, 3) xticks_labels = pd.date_range(proj_start, end=df.End.max()).strftime("%m/%d") xticks_minor = np.arange(0, df.end_num.max()+1, 1) ax.set_xticks(xticks) ax.set_xticks(xticks_minor, minor=True) ax.set_xticklabels(xticks_labels[::3]) plt.show() |
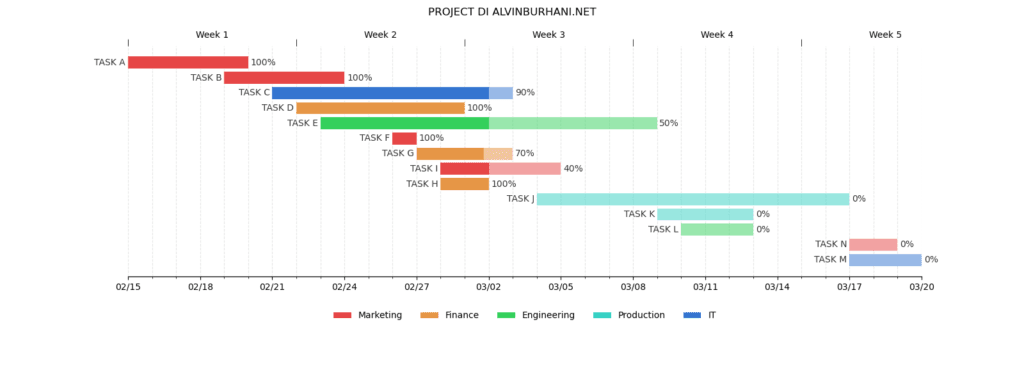
Sekarang kode kelengkapan proyek ke visualisasi dimana untuk meningkatkan presisi, persentase progress dituliskan di akhir grafik batang, dan untuk membedakan yang sudah selesai dari yang belum selesai, parameter alfa (transparensi) pada grafik juga divisualisasikan.
# days between start and current progression of each task df['current_num'] = (df.days_start_to_end * df.Completion) from matplotlib.patches import Patch fig, ax = plt.subplots(1, figsize=(16,6)) # bars ax.barh(df.Task, df.current_num, left=df.start_num, color=df.color) ax.barh(df.Task, df.days_start_to_end, left=df.start_num, color=df.color, alpha=0.5) # texts for idx, row in df.iterrows(): ax.text(row.end_num+0.1, idx, f"{int(row.Completion*100)}%", va='center', alpha=0.8) ##### LEGENDS ##### c_dict = {'MKT':'#E64646', 'FIN':'#E69646', 'ENG':'#34D05C', 'PROD':'#34D0C3', 'IT':'#3475D0'} legend_elements = [Patch(facecolor=c_dict[i], label=i) for i in c_dict] plt.legend(handles=legend_elements) ##### TICKS ##### xticks = np.arange(0, df.end_num.max()+1, 3) xticks_labels = pd.date_range(proj_start, end=df.End.max()).strftime("%m/%d") xticks_minor = np.arange(0, df.end_num.max()+1, 1) ax.set_xticks(xticks) ax.set_xticks(xticks_minor, minor=True) ax.set_xticklabels(xticks_labels[::3]) plt.show() |
Untuk membuatnya lebih menarik, menambahkan lebih banyak informasi dengan sumbu lain, menggambar garis kisi-kisi, menambahkan judul, dan banyak lagi. Memecah tugas, melacak ukuran kinerja, dependensi, pencapaian, tenggat waktu, dan banyak lagi. Menambahkan lebih banyak informasi ke bagan Gantt akan sangat mudah dicapai dengan lebih banyak pengkodean, tooltip, penelusuran detail, dan teks.
Berikut versi lengkapnya
1 2 3 4 5 6 7 8 9 10 11 12 13 14 15 16 17 18 19 20 21 22 23 24 25 26 27 28 29 30 31 32 33 34 35 36 37 38 39 40 41 42 43 44 45 46 47 48 49 50 51 52 53 54 55 56 57 58 59 60 61 62 63 64 65 66 67 68 69 70 71 72 73 74 75 76 77 78 79 80 81 82 83 84 85 86 87 88 89 90 91 92 93 94 95 96 97 98 99 | import pandas as pd import numpy as np import matplotlib.pyplot as plt from matplotlib.patches import Patch from pandas import Timestamp # project start date proj_start = df.Start.min() # number of days from project start to task start df['start_num'] = (df.Start-proj_start).dt.days # number of days from project start to end of tasks df['end_num'] = (df.End-proj_start).dt.days # days between start and end of each task df['days_start_to_end'] = df.end_num - df.start_num # days between start and current progression of each task df['current_num'] = (df.days_start_to_end * df.Completion) # create a column with the color for each department def color(row): c_dict = {'MKT':'#E64646', 'FIN':'#E69646', 'ENG':'#34D05C', 'PROD':'#34D0C3', 'IT':'#3475D0'} return c_dict[row['Department']] df['color'] = df.apply(color, axis=1) ##### PLOT ##### fig, (ax, ax1) = plt.subplots(2, figsize=(16,6), gridspec_kw={'height_ratios':[6, 1]}, facecolor='#36454F') ax.set_facecolor('#36454F') ax1.set_facecolor('#36454F') # bars ax.barh(df.Task, df.current_num, left=df.start_num, color=df.color) ax.barh(df.Task, df.days_start_to_end, left=df.start_num, color=df.color, alpha=0.5) for idx, row in df.iterrows(): ax.text(row.end_num+0.1, idx, f"{int(row.Completion*100)}%", va='center', alpha=0.8, color='w') ax.text(row.start_num-0.1, idx, row.Task, va='center', ha='right', alpha=0.8, color='w') # grid lines ax.set_axisbelow(True) ax.xaxis.grid(color='k', linestyle='dashed', alpha=0.4, which='both') # ticks xticks = np.arange(0, df.end_num.max()+1, 3) xticks_labels = pd.date_range(proj_start, end=df.End.max()).strftime("%m/%d") xticks_minor = np.arange(0, df.end_num.max()+1, 1) ax.set_xticks(xticks) ax.set_xticks(xticks_minor, minor=True) ax.set_xticklabels(xticks_labels[::3], color='w') ax.set_yticks([]) plt.setp([ax.get_xticklines()], color='w') # align x axis ax.set_xlim(0, df.end_num.max()) # remove spines ax.spines['right'].set_visible(False) ax.spines['left'].set_visible(False) ax.spines['left'].set_position(('outward', 10)) ax.spines['top'].set_visible(False) ax.spines['bottom'].set_color('w') plt.suptitle('PROJECT ALVINBURHANI.NET', color='w') ##### LEGENDS ##### legend_elements = [Patch(facecolor='#E64646', label='Marketing'), Patch(facecolor='#E69646', label='Finance'), Patch(facecolor='#34D05C', label='Engineering'), Patch(facecolor='#34D0C3', label='Production'), Patch(facecolor='#3475D0', label='IT')] legend = ax1.legend(handles=legend_elements, loc='upper center', ncol=5, frameon=False) plt.setp(legend.get_texts(), color='w') # clean second axis ax1.spines['right'].set_visible(False) ax1.spines['left'].set_visible(False) ax1.spines['top'].set_visible(False) ax1.spines['bottom'].set_visible(False) ax1.set_xticks([]) ax1.set_yticks([]) # Get "Today" value from sys date/ date.today() #from datetime import date #today = pd.Timestamp(date.today()) #today = today - proj_start # Get "Today" value from custom timestamp today = Timestamp('2022-03-02 00:00:00') today = today - proj_start # plot line for today ax.axvline(today.days, color='w', lw=1, alpha=0.7) ax.text(today.days, len(df)+0.5, 'Today', ha='center', color='w') plt.show() |
OutPut:
Terima kasih telah membaca artikel ini, semoga bermanfaat.